Central limit theorem states that sample means follow normal distribution. People often confuse this with and question the validity of uniform distribution of p-values under nul hypothesis. Should we not be observing extreme p-values much less ofter than usual pvalues like 0.2 or 0.3?
Imagine if null hypothesis is true. This means there is no difference betweem treatment and control.
import numpy as np
import pandas as pd
import statsmodels.api as sm
from scipy import stats
import matplotlib.pyplot as plt
pval_lis = []
t_stat_lis = []
samp_mean_lis = []

for i in range(100000):
    sample = np.random.normal(0, 1, 10)
    samp_mean = sample.mean()
    samp_mean_lis.append(samp_mean)
    t_stat = sample.mean()/(sample.std()/np.sqrt(sample.size))
    t_stat_lis.append(t_stat)
    pval = stats.t.sf(abs(t_stat), df=sample.size)*2
    pval_lis.append(pval)
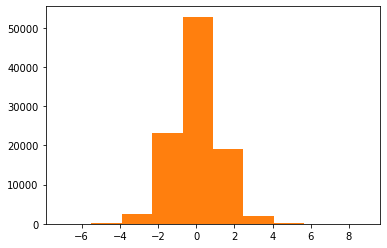
plt.hist(np.array(samp_mean_lis))

Distribution of sample means
plt.hist(np.array(t_stat_lis))
Distribution of t-statistics
plt.hist(np.array(pval_lis))

Distribution of p-values under the null hypothesis — uniformly distributed